
Custom Charts
Compare up to five companies on any metric, or put up to five metrics for one company on the same chart.
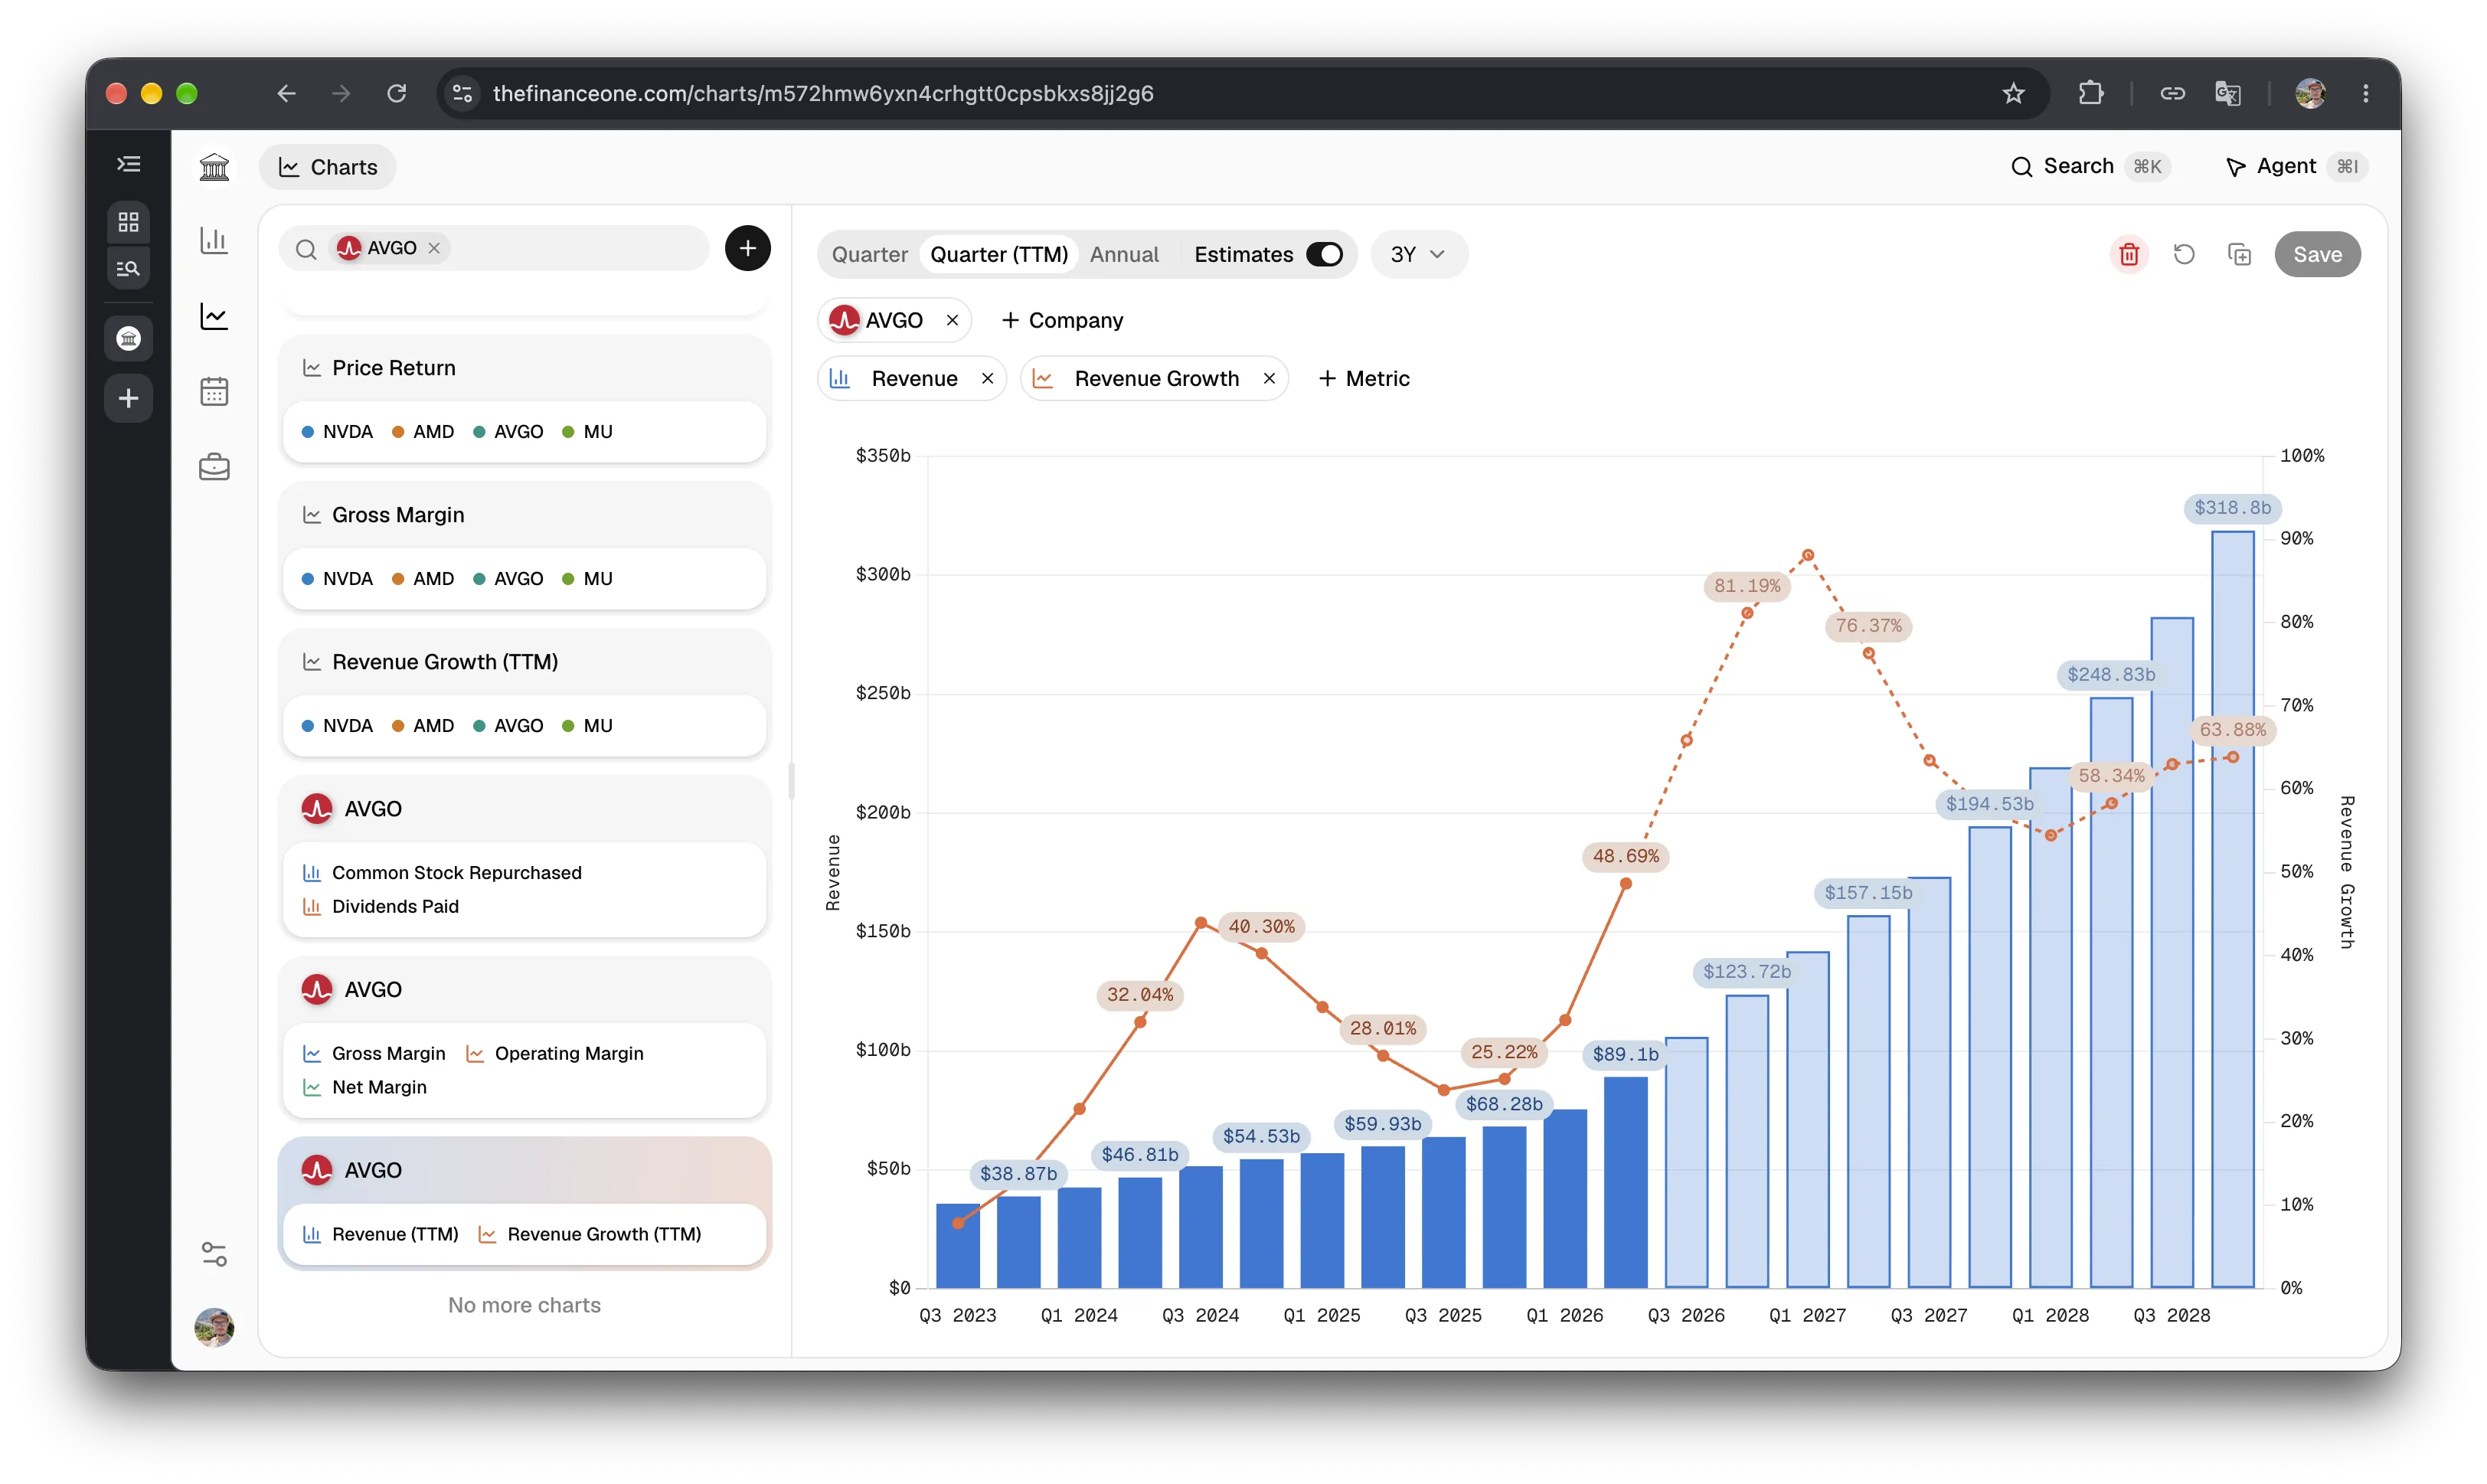
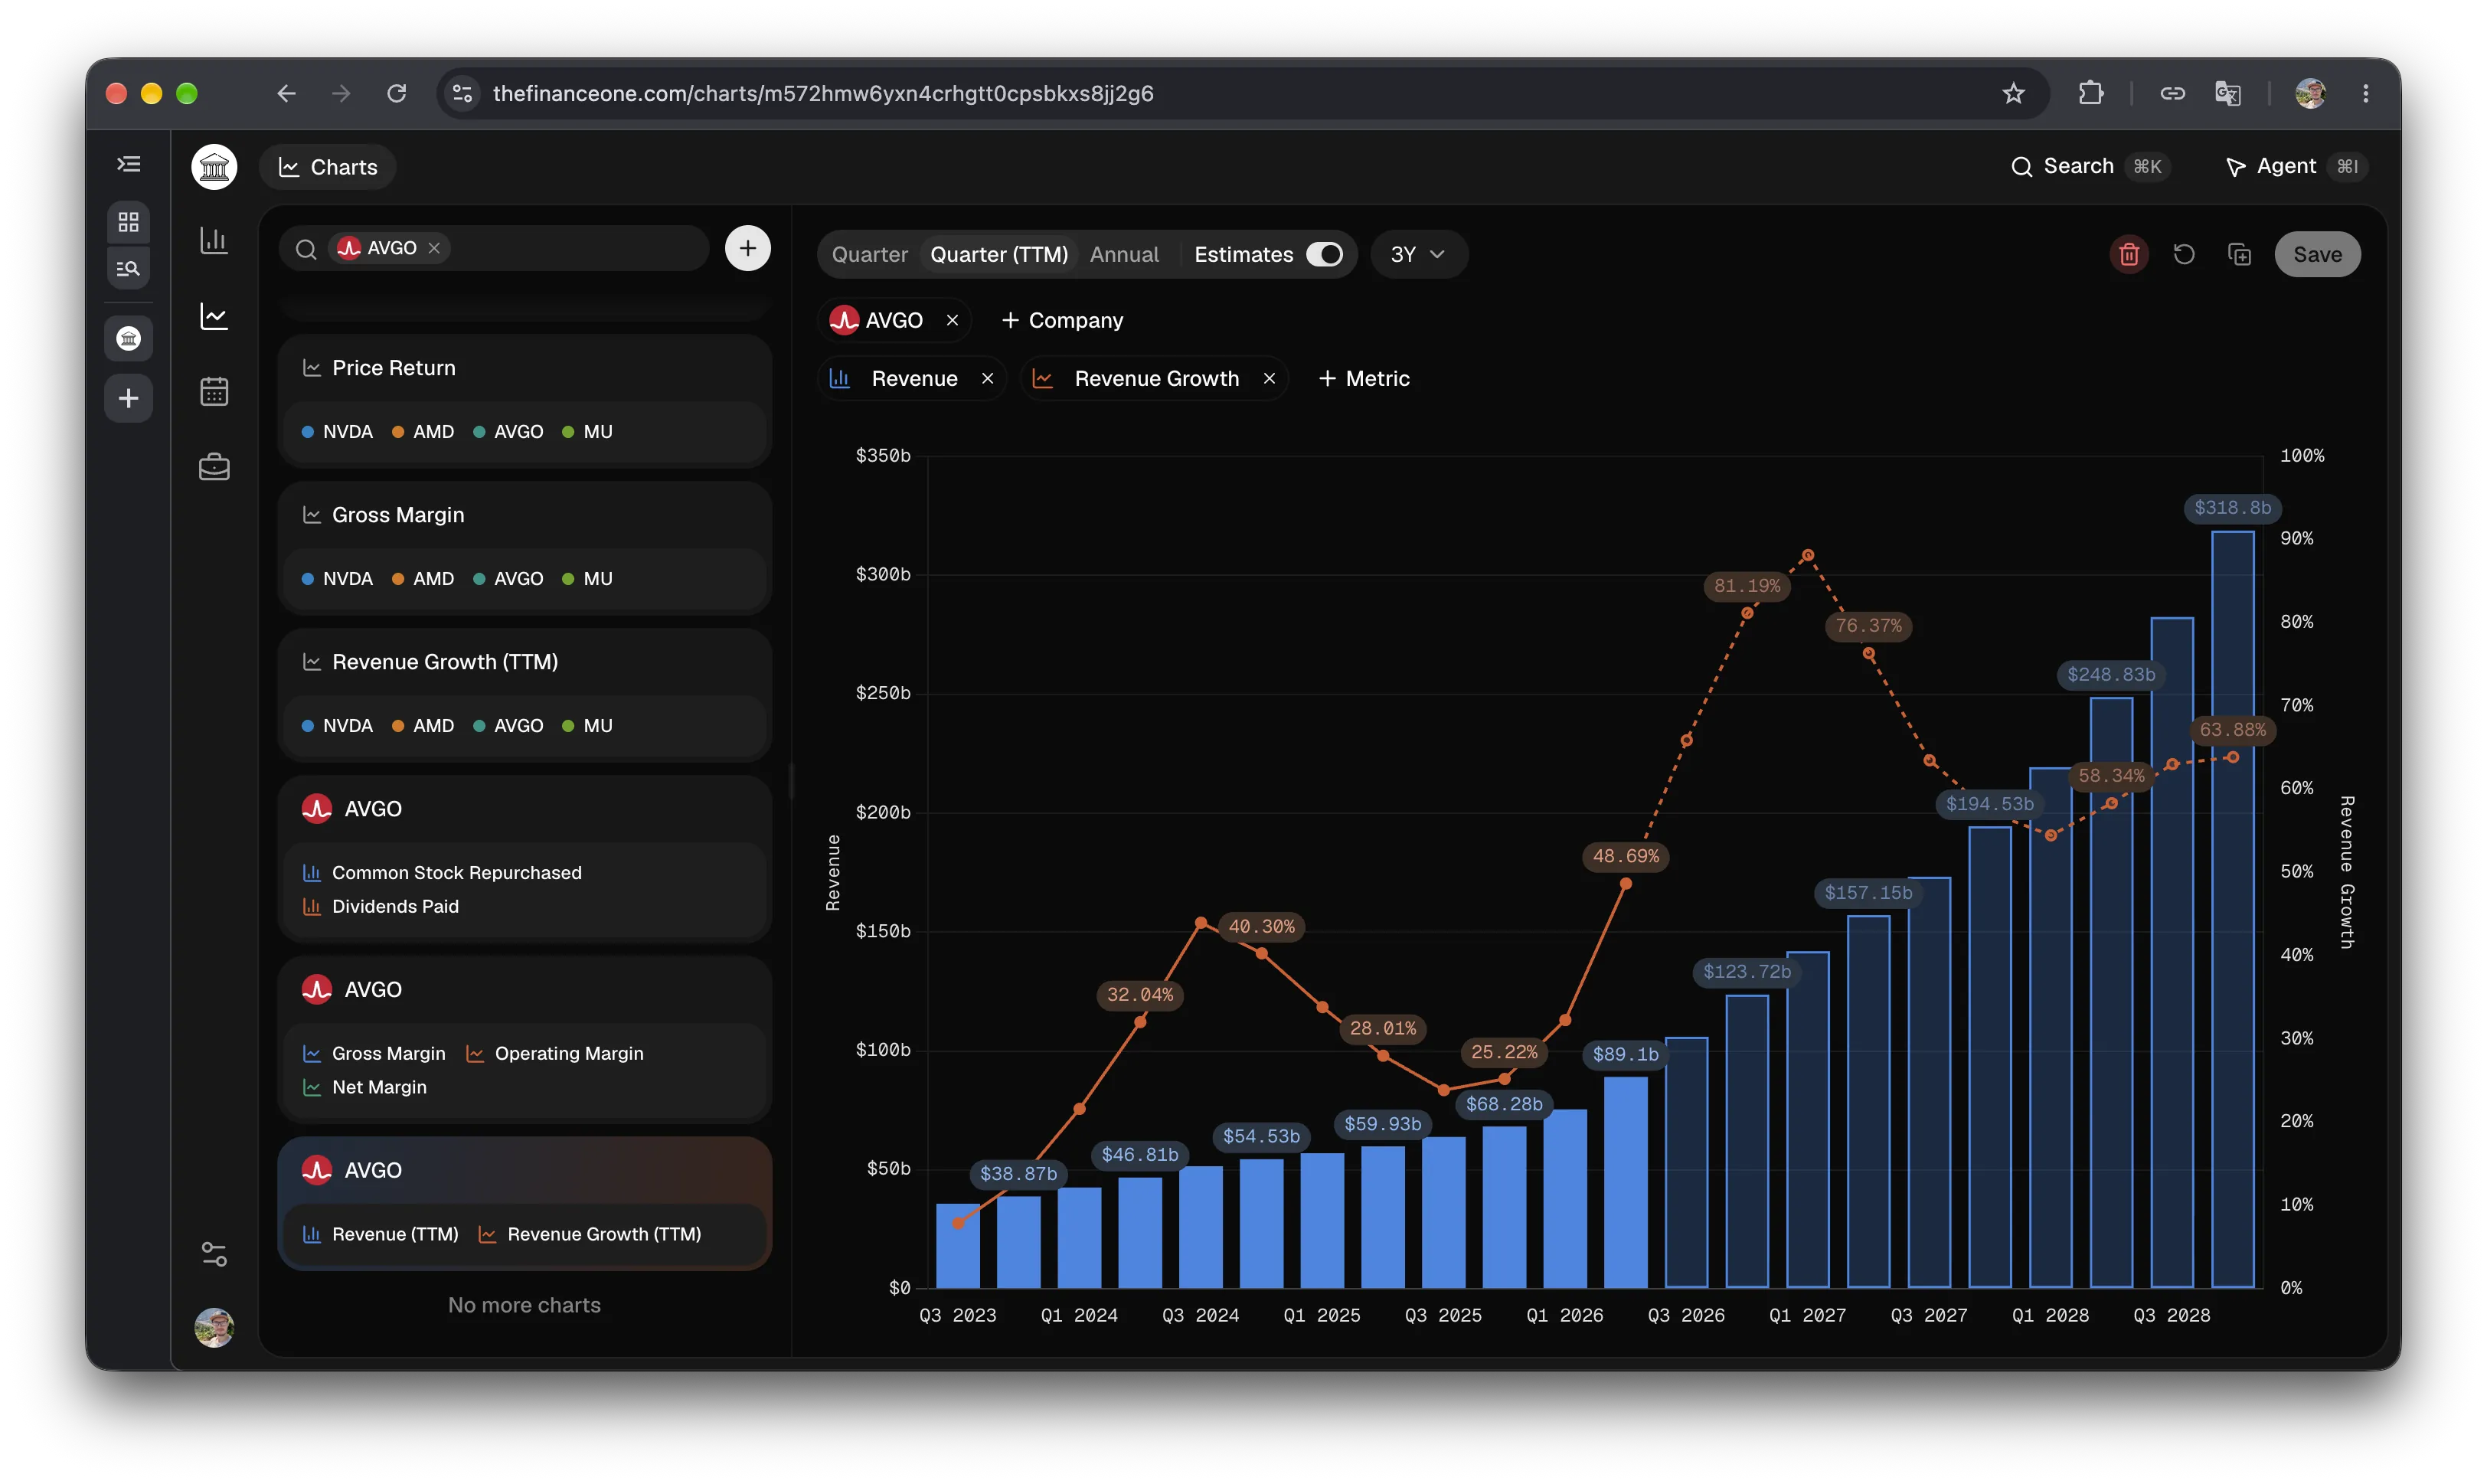
This one is Broadcom: revenue as bars, revenue growth as a line, and analyst estimates through 2028 as the lighter bars. One chart shows how big the business is, how fast it grows, and what is expected next.
- Compare companies. Up to five on one chart, on one or two metrics, such as gross margin for NVDA, AMD, AVGO, and MU. Everything is in US dollars and lined up by calendar quarter.
- Combine metrics. Up to five for one company, such as revenue with revenue growth, or buybacks next to dividends.
- Add price and valuation. Put the share price, P/E, or market cap on the same chart as the business, or compare price return against the S&P 500.
- See estimates. Analyst estimates continue the chart and are always dashed, so they never mix with reported results. One switch turns them off.
- Pick the period. Quarter, year, or trailing twelve months (TTM), from one year back to the full history.
- Save it. A saved chart updates on its own when the company reports.
- Ask AI. Say "compare NVDA and AMD revenue growth" and the Agent builds it.
- Use your own AI. Connect it through MCP and it builds charts too.
Prices are free for every company, financials for ten, and Membership opens the rest.
All 48 metrics
- Income: Revenue, Gross Profit, Operating Income, EBITDA, Net Income, EPS, Remaining Performance Obligations
- Price: Price, Price Return
- Valuation: Market Cap, P/E, P/S, P/FCF, EV/EBITDA, FCF Yield
- Growth: Revenue Growth, EBITDA Growth, Net Income Growth, EPS Growth, Free Cash Flow Growth, Dividend Growth, Shares Outstanding Growth
- Margins: Gross Margin, Operating Margin, Net Margin
- Cash flow: Operating Cash Flow, Capital Expenditures, Free Cash Flow, Free Cash Flow per Share, Stock-Based Compensation
- Spending: Capex to Revenue, R&D to Revenue, Stock-Based Compensation to Revenue
- Balance sheet: Cash, Debt, Leases, Net Cash, Total Equity, Debt to Equity
- Shareholder returns: Dividend, Dividends Paid, Common Stock Repurchased, Payout Ratio, Shares Outstanding, Dividend Yield
- Returns: Return on Capital Employed, Return on Equity, Return on Invested Capital
Disclaimer
The information provided on this platform is for educational and informational purposes only and should not be considered as financial advice. All investment decisions should be made based on your own research and consultation with qualified financial professionals. Past performance does not guarantee future results. The Finance One is not responsible for any investment decisions made based on the information provided. Always conduct your own due diligence and consider your risk tolerance before making any investment decisions.